Protocols
Cell Viability
Propidium Iodide (PI), DAPI, or Sytox Blue
Common dyes available that are quick and easy to use. Prepare stock solution of each dye to 100X, and use in the following staining protocol (Ex. If stock solution is 1mg/mL, dilute 1/10 in PBS 1X). It is often a good idea to add viability dyes prior to analysis or sorting of samples.
Staining Protocol
- Collect and spin cells down (500 x g, 5min, 4°C).
- Resuspend cells in 300uL of FACS buffer (1x PBS + 2% BSA + 2.5mM EDTA).
- Add 3uL of diluted dye at 100X.
- Vortex and incubate in the dark for 3min before analysis.
Excitation and Detection
- For PI use 488nm laser and 585/42 BP filter
- For DAPI use 405nm laser and 450/40 BP filter
- For Sytox Blue use 405 nm laser and 450/40 BP filter
Cell Cycle
Propidium Iodide (PI)
Fixation of cells
- Spin between 2-10 million cells down (500 x g, 5min, 4°C).
- Wash cells twice in 500uL Ca+2 and Mg+2 free Phosphate Buffer Solution (PBS).
- Resuspend cells in cold PBS to obtain a single cell suspension. Transfer to 15mL polypropylene conical.
- Add 4.5mL of 70% EtOH and store at 4°C for at least 2 hours. Optimal time for fixation is 12 – 24 hours.
Staining with PI
- Centrifuge cells (500 x g, 10min, 4°C). Resuspend cells in 5mL PBS and transfer to new 15mL conical.
- Recount cells and distribute at 2 x 10⁶ for staining (Note: Ratio of PI:cell number is important to keep consistent as it can effect staining and quality).
- Spin down (500 x g, 5min, 4°C) and resuspend in 300uL of PI/Triton X-100/RNase A staining solution.
- Incubate 15min at 37°C or 30min at 20°C while protected from light.
- If needed, store at 4°C for up to 48 hours.
- Transfer to appropriate tubes for flow cytometry acquisition.
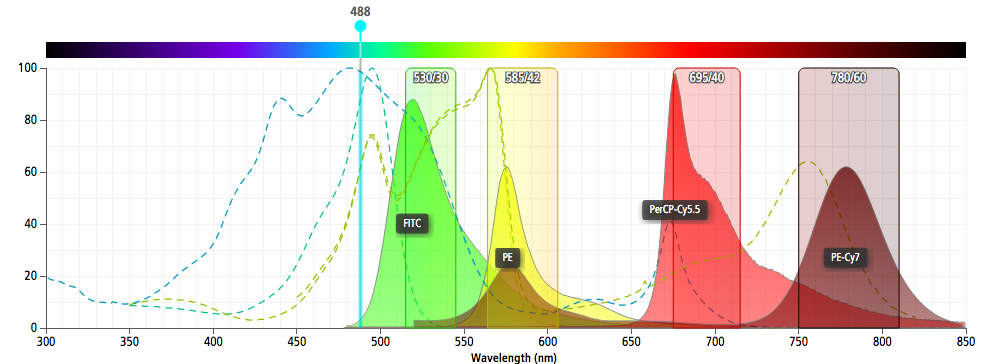
- Use 488nm laser for excitation and PE (585/42 BP filter) or PerCP-Cy5.5 (670 LP filter) parameters on linear for detection.
PI/Triton X-100/RNase A Solution: to 10mL of 0.1% (v/v) Triton X-100 in PBS add 2 mg DNase-free RNase A and 0.20mL of 1000ug/mL PI.
References
- Shapiro, HM, Practical Flow Cytometry, 2nd edition, New York: Alan R. Liss, Inc; 1988. p 353.
- Current Protocols in Cytometry. New York: J Wiley & Sons, eds. Robinson, J.P. et al. Inc: 1997. Chapter 7.
Cell Surface Antibody Staining
Surface Antibody Staining
For use with cultured cells, both adherent and non-adherent.
Staining buffer: PBS with 2%FCS/2mM EDTA
Protocol
- For non-adherent cells skep step 2
- For adherent cells, trypsinize or scrape cells, neutralize with growth medium and spin down cells (500 x g, 5min, 4°C).
- Perform wash step twice: Resuspend cells with 1mL PBS and spin down (500 x g, 5min, 4°C).
- Count cells, and resuspend to make concentration of 1 x 10⁷ cell/mL.
- Aliquot 100uL of suspension into 5mL tubes, spin down (500 x g, 5min, 4°C).
- Remove supernatant and resuspend cells in 100uL antibody/staining buffer mixture (1-10ugmL final concentration, reference manufacturer data sheet).
- Incubate 20-30 minutes on ice in the dark.
- Add 1mL of PBS and then spin down (500 x g, 5min, 4°C).
- For conjugated antibodies skip to step 11.
- Add 100uL of secondary antibody mixture and incubate 20min on ice.
- Spin down and wash twice (500 x g, 5min, 4°C).
- Resuspend in 300-500uL of 1X PBS for analysis.
- Add viability dye, vortex and analyze.
Enumeration
It can be difficult to determine absolute cell number of a given sample using flow cytometry. For eukaryotic, prokaryotic or viral phage enumeration experiments, a suspension of beads with a given concentration can be used to determine the absolute cell/particle number in a sample. There are many bead manufacturers on the market, and some that are even provided with staining kits, but it is important to take into consideration the size and fluorescent properties of the beads to ensure distinguishable characteristics from the sample, stain, or antibody fluorochrome.
With the BDFACS Canto high throughput sampler (HTS) it is possible to run specified volumes from 96 or 384-well plates. This format allows for addition of beads to a sample in order to quantify the absolute number of cells. The equation below should be used when determining absolute cell number.
Protocol
- Remove beads from fridge 30 minutes before use. Vortex or sonicate beads for 5-10 prior to addition to the sample.
- Add recommended volume by manufacturer to the sample for a maximum of 300uL in a 96-well plate.
- For 384-well plates maximum volume will be 100uL.
- Make sure to acquire enough volume for at least 1000 beads.
- Calculate cell concentration with formula below.
cell/uL = (#cell events / #bead events) x (beads in XuL / volume of sample) x sample dilution
Stem Cell Identification
Hoescht 33342
Staining performed with Hoescht 33342 can be used for cell viability discrimination, cell cycle assessment, and stem cell identification. Hoescht 33342 is cell membrane permeable and preferentially binds to A-T base regions in DNA. There are two binding modes that result in two different spectral emission wavelength that can be detected simultaneously. Stem cell populations will differentially efflux the dye through a multi drug-like transporter, allowing for the identification of stem cells as a side population.
Protocol
- Add Hoescht 33342 stain to the sample at a final concentration of 0.03mM.
- Incubate the sample at RT for 70 minutes.
- Use an unstained sample as negative control.
- Immediately before analysis stain with Propidium Iodide (As PI is not cell membrane permeable it is possible to use in tandem with Hoescht 33342 to differentiate dead cells).
- Analyze 375nm laser with 605/40-nm band pass filter for red emission and 450/20-nm band pass filter for blue emission.
References
Goodell, M. A. 2005. Stem Cell Identification and Sorting Using the Hoechst 33342 Side Population (SP). Current Protocols in Cytometry. 9:9.18.
Apoptosis and Necrosis
Annexin V and PI
Staining Protocol
- Spin between 1 x 10⁶ cells down (500 x g, 5min, 4°C), and wash twice in 500uL Ca+2 and Mg+2 free Phosphate Buffer Solution (PBS).
- Resuspend in 1mL of Annexin V binding buffer.
- Transfer 100uL into 5mL tube.
- Add 5uL of Annexin V and 5uL of PI.
- Gently vortex and incubate for 15min at RT in the dark.
- Add 400uL of 1X binding buffer, and analyze by flow cytometry within 1 hour.
Adopted from BD PharmingenTM Annexin V Apoptosis Detection Kit
http://www.bdbiosciences.com/us/applications/research/apoptosis/apoptosis-kits-sets/fitc-annexin-v-apoptosis-detection-kit-i/p/556547
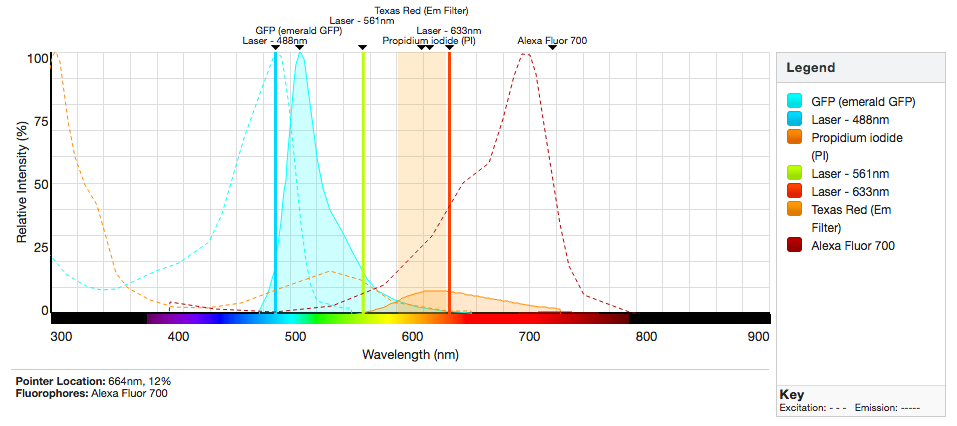
GFP and DNA Content
Propidium Iodide (PI) and GFP measurement can be done simultaneously. In order for PI to stain nucleic acid, it is necessary to fix and permeabilize the cells. It is thus important to use low concentrations of fixative in order to preserve the fluorescence of GFP.
Protocol
- Spin between 1 x 10⁶ cells down (500 x g, 5min, 4°C), and wash twice in 500uL Ca+2 and Mg+2 free Phosphate Buffer Solution (PBS).
- Remove supernatant and add 500uL of PBS to cells. Add another 500uL of 1% fixative solution and incubate on ice or at 4°C for one hour.
- Wash cells twice with PBS through centrifugation (500 x g, 5min, 4°C).
- Add 1mL 70% ethanol at -20°C drop-wise to the cell pellet with the tube on a vortex.
- Incubate overnight at 4°
- Spin the cells down (500 x g, 5min, 4°C), and resuspend with 1mL of PI working solution (40ug/mL of PI + 100ug/mL of RNase A).
- Analyze with appropriate controls (fixed/permeabilized cells with no GFP and fixed/permeabilized cells with GFP and no PI)
References
Current Protocols in Cytometry. J Wiley & Sons, N.Y. 7.6.1-7.6.10, 1997.
Antibody Titration
It is important to reference the data sheet from the manufacturer of your antibody. This will have information about the clone, isotype, working dilution, reactivity, etc. For antibodies that need a secondary antibody, it is best to optimize the primary antibody first with a fixed secondary antibody concentration (use concentration recommended by manufacturer). Once primary concentration is calibrated, do similar optimizing for the secondary antibody.
For cell surface staining it is important to use a cell type or activated cell that expresses a high number of available antigens for binding. The highest signal-to-noise ratio, or positive to negative (non-specific binding) ratio, is the determinant for the best concentration of antibody. This can be determined by dividing the mean fluorescence intensity (MFI) of the experimental dilution samples to the negative isotype control sample. As the concentration of antibody increases there will be a point of saturation, as the ratio will not increase anymore. The optimal concentration is the highest dilution, or lowest concentration of antibody, that has the highest signal-to-noise ratio.
For indirect antibody staining, prepare cells alone, an isotype negative control, as well as a secondary only control. These serve as controls for autofluorescence, gating, and background. For conjugated antibodies skip to step 2 and resuspend in 1mL of PBS. For conjugated antibody experiments, it is necessary to prepare cells unstained, and cells with a detecting species IgG as negative controls.
Staining Protocol
- Prepare secondary antibody at recommended concentration by manufacturer (usually 200ug/mL).
- Spin down 6-8 x 10⁶ cells and resuspend in 1mL of secondary antibody solution (or just PBS for conjugated antibodies).
- Aliquot 100uL of cells into 6-8 tubes on ice for to obtain 1 x 10⁶ cells, the dilution series.
- Prepare the desired number of dilutions of the primary antibody by starting with 8uL of stock antibody into 92uL of staining buffer (1/12½ dilution).
- Use the 100uL of diluted antibody in step 3 with 100uL of cells and staining buffer mixture, to serial dilute 6-8 times (this results in 1/25, 1/50, 1/100, etc. dilution series). NOTE: This can be done in a 96-well plate.
- Incubate 20-30min in the dark.
- Spin the cells down and wash with 200uL of staining buffer.
- Repeat wash step.
- Resuspend in 200uL 1X PBS.
- Start analysis with most diluted concentration to adjust parameters.
References
- Current Protocols in Cytometry. J Wiley & Sons, N.Y., eds. Robinson, J.P. et al, 4.1-4.4, 1997.
Phage Enumeration
SYBR Green Staining Protocol
- Prepare control phage (T4) to 7×10⁵ phage/mL
- Use TE buffer pH8.0 and dilute phage lysates 1:100
- Dilute SYBR Green from 10,000x stock solution. Dilute 1:100 w/ 100%DMSO (use nH20 to dilute further if necessary).
- Add amount for 0.5x final staining concentration (You will be adding 0.5-2uL of SYBR per 100uL of sample). Make sure no excess SYBR (often on side of pipette tip) is introduced.
- Stain phage with SYBR Green at 80°C for 10min, using PCR thermocycler.
- “Cool” for 3-5min at 23°C
- Transfer to 96 v-bottom well plate for analysis.
- Add beads for enumeration (Refer to enumeration protocol).
References
Adopted from:
Brussaard CPD., Enumeration of Bacteriophages Using Flow Cytometry. Bacteriophages: Methods and Protocols, Volume 1: Isolation, Characterization, and Interactions. eds. Clokie, M.R.J. et al. 2009.
Resources

Purdue University Cytometry List:
Free sign up to the PUCL gains you access to the worldwide flow cytometry community. Search the archives for previously discussed detail, or send out a new question.
Current Protocols in Cytometry provides detailed protocols for every type of experiment a user can imagine. If you have questions or are unable to access a specific protocol, the core can provide it for you.
Spectrum Viewers